
Catch up on what you missed at Radiodays Europe and Podshow London, plus how you can get into our Business Leaders Summit later this summer when you listen to this week’s episode of Sounds Profitable: Adtech Applied!
Tom writes…
Two weeks ago, in this very space, Bryan Barletta wrote that “While hosting platforms and prefix analytics partners can both achieve IAB certification, they are not equal. Hosting platforms will always see the full request from the podcast player, along with the entire response they send back, whereas prefix analytics partners can only see the request.” That’s the technical distinction, in a nutshell, and Bryan understands that aspect of the download better than anyone. I want to rotate the problem around and look at it from a different perspective: the listener.
There are a number of services available to podcasting that measure the space from the perspective of the data, most of which adhere to a set of agreed-upon guidelines. Yet the outputs from these services can differ, sometimes dramatically. The truth is that there is no One True Way (I strongly suspect there never will be) but these approaches in combination provide podcasting with richer and deeper analytics than are available with radio, TV, or public relations. Podcasting is too often compared to digital display and found wanting, rather than to radio, which gives us none of the rich digital data podcasting provides.
Today, many hosting platforms and measurement services follow the same guidelines to count downloads—guidelines agreed upon by a subcommittee of the IAB. Based on that, you might assume that “the data is the data,” and that any two entities looking at the same data file would reach the same conclusions. But in reality there are, of course, differences in how the various analytics platforms parse these data. Different hosting platforms might have different stop lists, for example—IP addresses that have been identified as bots, and not humans. The differential application of IAB guidelines to count downloads is a tussle for another day, however. Instead, I want to look at the “other” column in your stats or measurement platform: the estimated users, or audience, for a podcast.
Estimates Aren’t Guesses
This is really the first point to make—these figures are estimates. In media ratings, an estimate is not a bad word, and it certainly doesn’t mean “guess.” An estimate is simply a number that, while inexact, behaves within certain parameters. As long as we have some kind of window into how that estimate is derived, we can contextualize the data. Estimates are generally composed of two things: the raw data that goes into them, and the assumptions that the “estimator” makes about the meaning of that data.
Today we have three different ways to estimate the audience for a podcast, and by extension, a podcast network: ingesting server logs, which provides a holistic view of the actual flow of content but requires a more intrusive measurement regime; prefix analytics, which provides some measure of the number of requests for podcast content but lacks the ability to report on the actual delivery of that content; and survey data, which estimates audience, but lacks the resolution to go into much depth on individual podcasts. How do we make sense of these? To start, let’s take a quick look at an example of each to see where they agree, and where they differ, in terms of estimated audience.
- Triton Digital’s Podcast Reports parses server logs to calculate weekly downloads. In addition, Triton provides a column for weekly users (and not the more elusive “listeners”) and details their adherence to the IAB 2.1 spec for this calculation, which is based on a combination of IP address, user agent, and time stamp as parsed from server logs.
- Podtrac, on the other hand, uses prefix analytics rather than server logs, and reports a figure they call “U.S. Unique Monthly Audience.” This is defined as the “total of unique audience members who stream or download publisher’s podcast content across all shows they produce.” It should also be noted that this estimate is provided for monthly audience, as opposed to the weekly figures provided by Triton.
- Finally, Edison Podcast Metrics does not measure downloads or “users” at all, but estimates the weekly reach of the leading podcast networks as defined by the percentage of weekly podcast listeners who indicated that they listened to at least one show from that network in the last week. This is done through a large, daily-sampled survey of listeners that is weighted to the company’s annual Infinite Dial survey demographics.
All three services publish a producer/network ranker. Triton’s ranker is listed in order of U.S. downloads, but the corresponding figure is not provided publicly by Podtrac. Instead, the rank order is determined by their “U.S. Monthly Audience” estimate. And Edison’s ranker does not provide any corresponding audience estimates, but is listed in order of the overall reach of each network.
Charting The Charts
So, how do we make sense of these three types of rankers? First, let me say again that podcasting actually has an embarrassment of riches in terms of data compared to other forms of media. But it might help to put all three of these audience measurement tools into a greater context—the total audience for podcasting, period.
For that, let’s use two very useful numbers as boundaries: 109 million, and 74 million. These are the current estimates for the total size of the U.S. Monthly and Weekly audience for podcasting, respectively, as recently published in the Infinite Dial 2022 from Edison Research, Wondery, and ART19. These estimates are reliable and projectable to the U.S. population 12+, and the proof of that is in the pudding—with the exact same methodology replicated year after year for nearly 15 years, podcasting’s audience estimates have “behaved” and shown a logical, gradually upward trend.
So, we have our first sanity check—no one’s weekly audience estimate should exceed the total weekly audience for podcasting. Check. We are on solid ground there. So, let’s dive ever so shallowly into the pool of rankings for April (Triton and Podtrac) and Q1 2022 (Edison):
| Triton | Edison | Podtrac |
| 1. Stitcher (SXM) | 1. SXM | 1. iHeart |
| 2. NPR | 2. Spotify | 2. NPR |
| 3. Audacy | 3. iHeart | 3.Wondery |
| 4. Audioboom | 4. NPR | 4. The New York Times |
| 5. Wondery | 5. The New York Times | 5. NBC News |
A couple of things to note right away that industry veterans are already aware of: no download measurement system covers all companies (Triton does not measure iHeart or The New York Times, for instance, while Podtrac does not measure SXM or Spotify’s original content). One thing that a deeper look at these rankers will show is that, generally, where two or more list the same company, the pecking order isn’t that different. In some cases those differences are simply differences in reporting (for example, Edison Podcast Metrics rolls up all of SXM’s shows into one measure, while Triton breaks out the component networks.)
Let’s start with the one network that is in all three top five rankings: NPR. Not much of an argument there. Podtrac estimates their monthly unique audience at about 20,500,000, while Triton estimates their weekly users to be about 6,900,000 (I rounded, obvs.) How can we compare these? OK, I am about to commit what I believe is the only potential datacrime* in this article—transferring the relationship between overall weekly and monthly listeners in America to this calculation. The number of weekly listeners in the US is approximately 67% of the number of monthly listeners (that’s 74 million divided by 109 million.) So I am going to discount Podtrac’s monthly numbers by 67% to approximate a weekly figure.
*(This is a potential datacrime because there are other variables that can affect this multiplier–like the average cadence of release per company. The New York Times, for example, is highly likely to convert a higher percentage of their monthly listeners to weekly listeners simply because they are releasing their shows more frequently compared to another network that mainly features weekly shows. This is also an assumption. Like I said: datacrime.)
OK: so if we take Podtrac’s figure for NPR and apply our “weekly coefficient” to it, we get a weekly Unique Audience estimate of about 13,700,000. That is twice what Triton estimates to be NPR’s average weekly users. Now, you can quibble with my .67. Heck, change it to .5, or .75. The story remains the same: Podtrac’s unique audience estimate is much higher than Triton’s user estimate. The open question: is this idiosyncratic to this one example? Or is there some kind of rule to be drawn here about the relationship of measuring requests (prefix analytics) and content served (server log ingestion)?
The Outer Reaches
It’s here that survey data can step in as a useful check. For instance, let’s take a look at iHeart, which Podtrac has at #1 and Edison at #3 (Triton currently does not list iHeart as a participating publisher). According to Podtrac, iHeart’s current U.S. Monthly Unique Audience is about 31,200,000. To make sense of that figure, let’s superimpose the total monthly audience for podcasting from Infinite Dial: 109,000,000. This gives us a percentage reach of about 29% of the monthly audience for podcasts. Is this plausible?
For that, we have only the last publicly-available hint of reach percentages from Edison, recorded in 2020: the number one network in podcasting by reach covered 22% of the available audience (again, these are based on weekly reach/weekly audience, but that is at least apples to apples.) iHeart is currently number three on the Edison ranker, behind SXM and Spotify. If this reach estimate is still in the same neighborhood as it was in 2020, then it seems unlikely that the number three network would reach 29% of the available audience. In fact, it very nearly takes the top two networks to reach that many listeners, according to that 2020 chart.
I look at survey-based data as a bit of a sanity check on download data. Only download data can give you a depth of knowledge on individual podcasts, but extrapolating audience metrics solely from prefix analytics data is fraught with danger because not all “requests” are the same.
Consider this: if I listen to a podcast at home on my laptop computer, then pick it up later in my car using my cell phone, I’m two different people to a prefix analytics service. There’s no way around this. This sort of behavior is much more likely to occur in a typical week with a daily podcast than a weekly podcast, right? It is much more likely that you are using two or more IP/user agent combinations in a week for a show that comes out five times in that week than one that only comes out once, and is listened to in one sitting.
There is also the differential between the various platforms. A download from the iOS Podcast App and one from Spotify are different dogs when you factor in the differential auto-download behavior for both. And, to throw some more gas on the fire, some types of podcast content (a daily news show, for instance) lend themselves more to co-listening with others than, say, audio fiction.
Wrapping Up
My intent is not to cast doubt on downloads. It is more to poke at the calculations used to extrapolate audience from those downloads. Extrapolating data like this is a lot like flying a plane across the country: if you are one degree off at the start, you could end up in Vancouver instead of Los Angeles. Like any good scientist, I want to be able to replicate the experiment. I want to be able to do it myself, to see if I get the same results. To do that, we need to open every black box and see what is inside. Ultimately, the most complete data on the actual transmission of content is going to be contained within server logs, which is going to make the hosting platforms more and more important as we continue to get better and better metrics on ad serving and impressions. But survey data is going to have its place, just as it does in every other modern media measurement system.
I want more transparency in this space, which means in the context of prefix analytics measurement, to quote my 9th grade math teacher, “show me your work.” For the rest of us, the advice is simple: go with the most conservative audience estimate you have, consult multiple sources, and use your common sense.
New Sponsors
Sounds Profitable exists thanks to the continued support of our amazing sponsors. Each sponsor receives one hour of consulting per month as a way to say thanks.
- Voxtopica helps subject matter experts (and the organizations that support them) make meaningful, compelling, engaging podcasts that educate, inform, and delight highly targeted audiences.
- Podsights – Dynamically inserted podcast ads outperformed embedded ads by 28% according to Podsights’ latest benchmark report. Request the full report to find out more!
Thanks for the Recs, Rel!
Arielle Nissenblatt of EarBuds Podcast Collective this week has chosen EarBuds Podcast Collective!
If that sound a little self-serving, it isn’t really. More an acknowledgment of Arielle’s hard work making solid choices on what next podcasts should be in your listening queue. So if you’ve enjoyed Rel’s Recs, you’re going to love what she has going on over at EarBuds Podcast Collective. Subscribe to her newsletter and follow her podcast to keep the recommendations coming!
Market Insights with Magellan AI
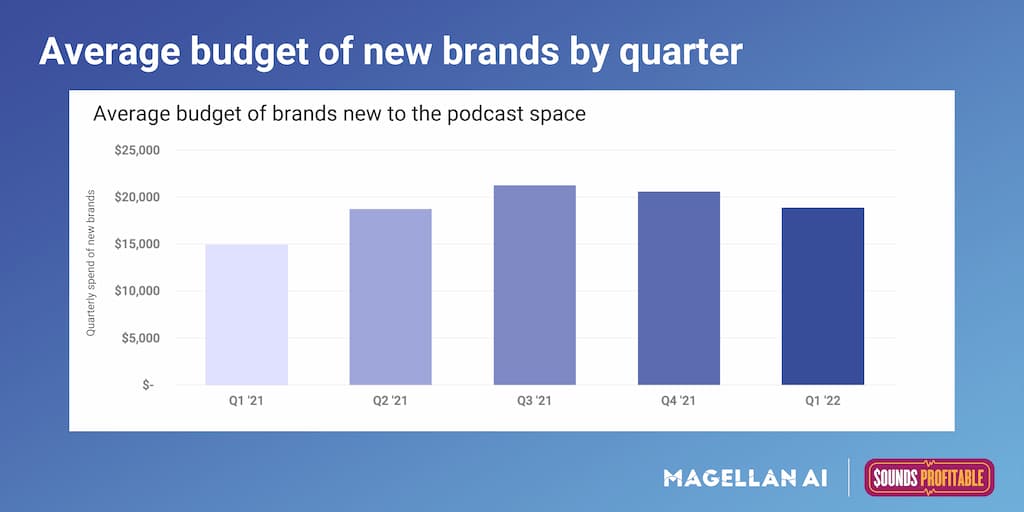
In our Quarterly Benchmark Report we report some of the latest trends we have picked up surrounding new brands. Things like total number of new brands added, average ad length, average ad position, and average quarterly spend. For this week we plotted average quarterly spend since Q1′ 21 to see how it has changed over time.
We found that over the last 5 quarters, average spend peaked in Q3′ 21 at a little over $20k. Overall in 2021, average quarterly spend was $18k, coming from around 8000 new brands picked up throughout the year. In Q1′ 21 average spend was $19k, coming from 1800 new brands. Overall average spend for new brands has been picking up since 2021, which is in line with overall spending trends.
Interested in more insights like this? Download the Q1’22 Podcast Advertising Benchmark Report for a full analysis.
Anatomy of an Ad with ThoughtLeaders

Sponsoring brand: ZocDoc
Where we caught the ad: Love + Relationships with Debra Fileta
Who else has sponsored this podcast? Athletic Greens, Trade Coffee, Imperfect Foods, Everlywell, Olive + Jane
Where else has this brand appeared? Be There in Five, Trace Evidence, We Met At Acme, The NewsWorthy, Raising Good Humans
Why it works: As a professional counselor, Debra Fileta knows firsthand how important it is to have access to good healthcare – so her partnership with ZocDoc just makes sense. Fileta highlights ZocDoc’s unique points – a free app that allows patients to add reviews and lets them check their insurance options. The ad is concise, sounds genuine, and fits seamlessly with the content of the podcast.
Check out all the in-depth Anatomy of an Ad from ThoughtLeaders!